原创文章,转载请注明: 转载自慢慢的回味
上一次,我们完成了搭建单节点Kubernetes环境。现在在其基础上继续搭建EFK(Elastic Search, Fluentd, Kibana)日志收集系统。
Elasticsearch 安装
Elasticsearch 安装时需要开启HTTPS。
kubectl create namespace efk cat <<EOF > es_extracfg.yaml xpack: security: enabled: "true" authc: api_key: enabled: "true" EOF helm upgrade --install my-elasticsearch bitnami/elasticsearch -n efk --set security.enabled=true --set security.elasticPassword=YourPassword --set security.tls.autoGenerated=true --set-file extraConfig=es_extracfg.yaml |
需要修改Stateful Set “my-elasticsearch-coordinating-only”和“my-elasticsearch-master”的内容如下,否则数据传输不成功:
resources: requests: cpu: 25m memory: 512Mi |
Kibana 安装
Kibana 安装的时候需要指定Elastic Search服务器的地址,密码为Elastic Search服务器的密码。这儿必须连接HTTPS接口。
helm upgrade --install my-kibana bitnami/kibana -n efk --set elasticsearch.hosts[0]=my-elasticsearch-coordinating-only --set elasticsearch.port=9200 --set elasticsearch.security.auth.enabled=true --set elasticsearch.security.auth.kibanaPassword=YourPassword --set elasticsearch.security.tls.enabled=true --set elasticsearch.security.tls.verificationMode=none |
Fluentd 安装
手动添加如下配置,通过@type elasticsearch把日志转发到Elastic Search服务器上面。
kind: ConfigMap apiVersion: v1 metadata: name: elasticsearch-output namespace: efk data: fluentd.conf: | # Prometheus Exporter Plugin # input plugin that exports metrics <source> @type prometheus port 24231 </source> # input plugin that collects metrics from MonitorAgent <source> @type prometheus_monitor <labels> host ${hostname} </labels> </source> # input plugin that collects metrics for output plugin <source> @type prometheus_output_monitor <labels> host ${hostname} </labels> </source> # Ignore fluentd own events <match fluent.**> @type null </match> # TCP input to receive logs from the forwarders <source> @type forward bind 0.0.0.0 port 24224 </source> # HTTP input for the liveness and readiness probes <source> @type http bind 0.0.0.0 port 9880 </source> # Throw the healthcheck to the standard output instead of forwarding it <match fluentd.healthcheck> @type stdout </match> # Send the logs to the standard output <match **> @type elasticsearch include_tag_key true scheme https host my-elasticsearch-coordinating-only port 9200 user elastic password YourPassword ssl_verify false logstash_format true logstash_prefix k8s request_timeout 30s <buffer> @type file path /opt/bitnami/fluentd/logs/buffers/logs.buffer flush_thread_count 2 flush_interval 5s </buffer> </match> |
helm upgrade --install my-fluentd bitnami/fluentd -n efk --set aggregator.configMap=elasticsearch-output |
Kibana 管理界面
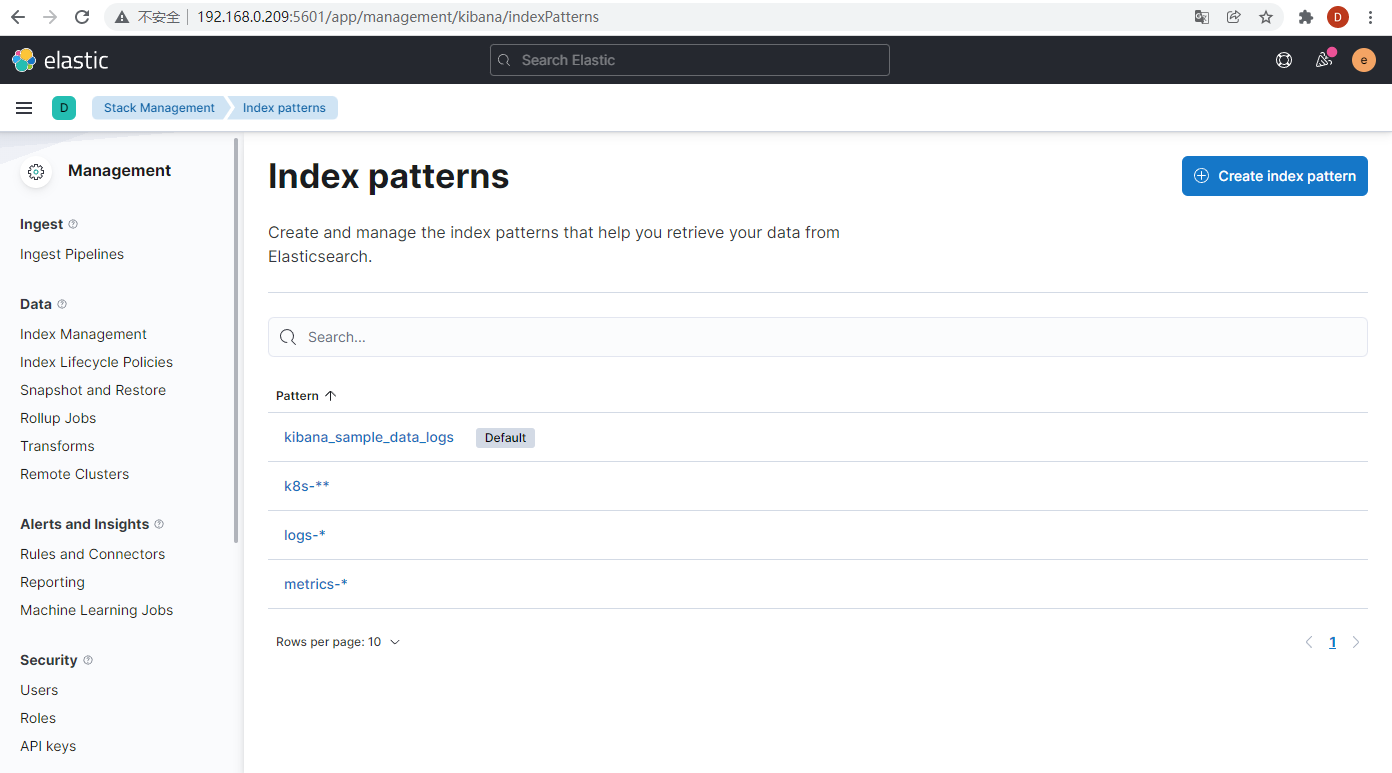
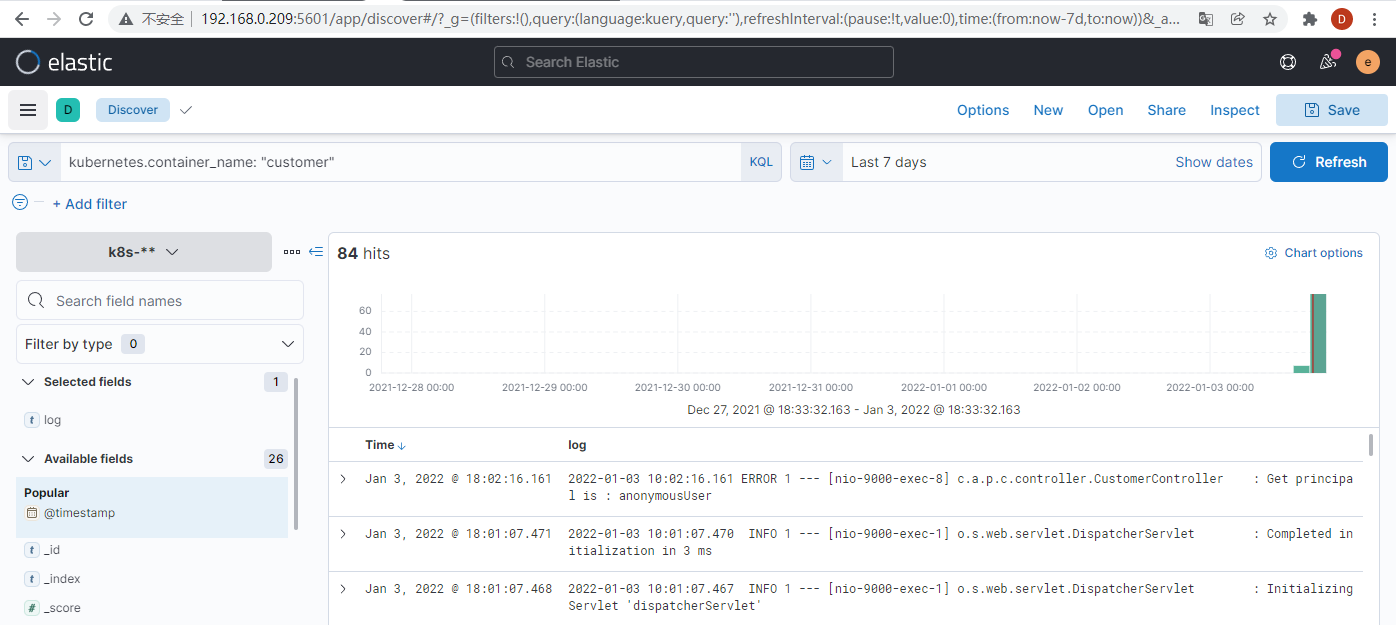
添加Index Pattern后可以查看log
本作品采用知识共享署名 4.0 国际许可协议进行许可。